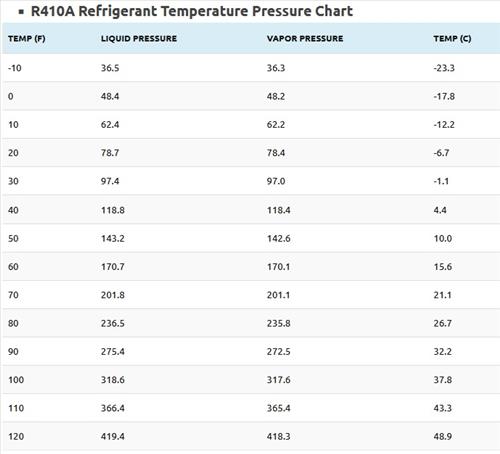
- R410A Refrigerant Pressure Temperature Chart
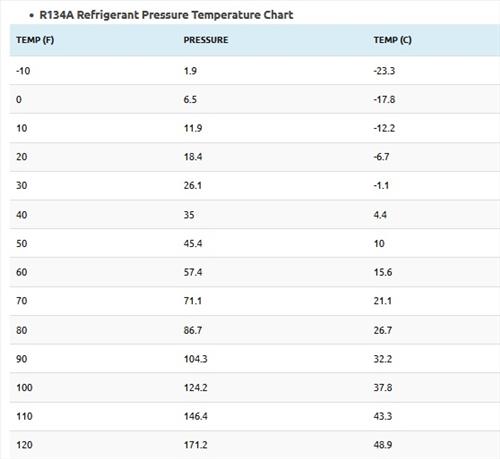
- R134A Refrigerant Pressure Temperature Chart
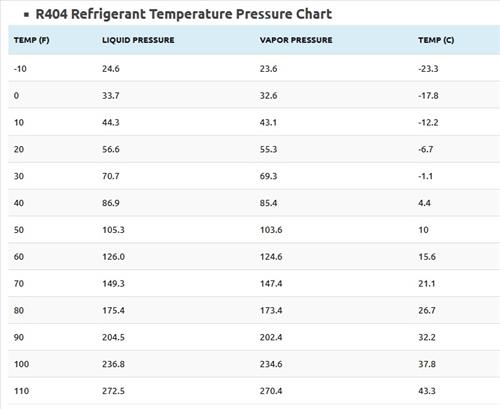
- R404 Refrigerant Pressure Temperature Chart
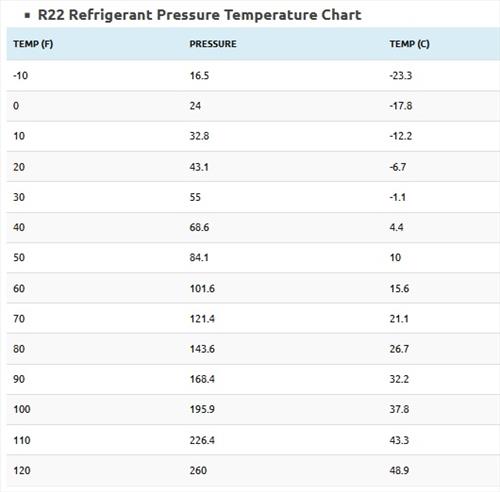
- R22 Refrigerant Pressure Temperature Chart
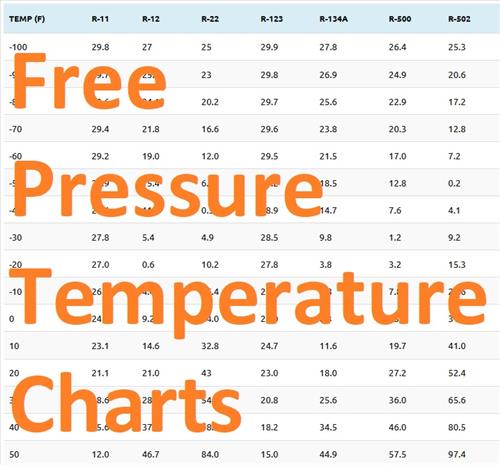
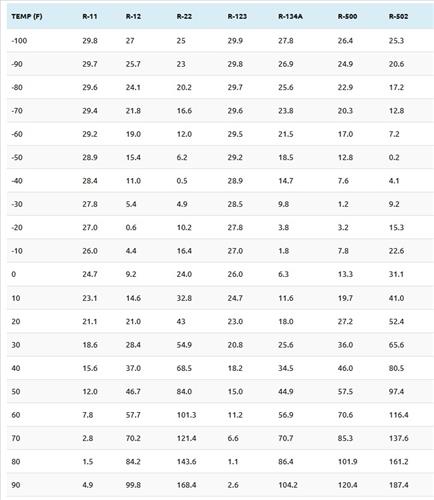
- Pressure Temp Chart R-11, R-12, R-22, R123, R134A, R404A, R-500, R502
Using an HVAC refrigerant pressure temperature chart is necessary to be sure a unit is operating correctly.
Below are three free pressure temperature charts that can be used to troubleshoot an HVAC unit.
Free Refrigerant Temperature Pressure Charts
- R410A Refrigerant Pressure Temperature Chart
- R134A Refrigerant Pressure Temperature Chart
- R404 Refrigerant Pressure Temperature Chart
- R22 Refrigerant Pressure Temperature Chart
- Pressure Temp Chart R-11, R-12, R-22, R123, R134A, R404A, R-500, R502
| TEMP (F) | Liquid Pressure | Vapor Pressure | TEMP (C) |
|---|---|---|---|
| -10 | 36.5 | 36.3 | -23.3 |
| 0 | 48.4 | 48.2 | -17.8 |
| 10 | 62.4 | 62.2 | -12.2 |
| 20 | 78.7 | 78.4 | -6.7 |
| 30 | 97.4 | 97.0 | -1.1 |
| 40 | 118.8 | 118.4 | 4.4 |
| 50 | 143.2 | 142.6 | 10.0 |
| 60 | 170.7 | 170.1 | 15.6 |
| 70 | 201.8 | 201.1 | 21.1 |
| 80 | 236.5 | 235.8 | 26.7 |
| 90 | 275.4 | 272.5 | 32.2 |
| 100 | 318.6 | 317.6 | 37.8 |
| 110 | 366.4 | 365.4 | 43.3 |
| 120 | 419.4 | 418.3 | 48.9 |
| TEMP (F) | PRESSURE | TEMP (C) |
|---|---|---|
| -10 | 1.9 | -23.3 |
| 0 | 6.5 | -17.8 |
| 10 | 11.9 | -12.2 |
| 20 | 18.4 | -6.7 |
| 30 | 26.1 | -1.1 |
| 40 | 35 | 4.4 |
| 50 | 45.4 | 10 |
| 60 | 57.4 | 15.6 |
| 70 | 71.1 | 21.1 |
| 80 | 86.7 | 26.7 |
| 90 | 104.3 | 32.2 |
| 100 | 124.2 | 37.8 |
| 110 | 146.4 | 43.3 |
| 120 | 171.2 | 48.9 |
| Temp (F) | Liquid Pressure | Vapor Pressure | Temp (C) |
|---|---|---|---|
| -10 | 24.6 | 23.6 | -23.3 |
| 0 | 33.7 | 32.6 | -17.8 |
| 10 | 44.3 | 43.1 | -12.2 |
| 20 | 56.6 | 55.3 | -6.7 |
| 30 | 70.7 | 69.3 | -1.1 |
| 40 | 86.9 | 85.4 | 4.4 |
| 50 | 105.3 | 103.6 | 10 |
| 60 | 126.0 | 124.6 | 15.6 |
| 70 | 149.3 | 147.4 | 21.1 |
| 80 | 175.4 | 173.4 | 26.7 |
| 90 | 204.5 | 202.4 | 32.2 |
| 100 | 236.8 | 234.6 | 37.8 |
| 110 | 272.5 | 270.4 | 43.3 |
| Temp (F) | Pressure | Temp (C) |
|---|---|---|
| -10 | 16.5 | -23.3 |
| 0 | 24 | -17.8 |
| 10 | 32.8 | -12.2 |
| 20 | 43.1 | -6.7 |
| 30 | 55 | -1.1 |
| 40 | 68.6 | 4.4 |
| 50 | 84.1 | 10 |
| 60 | 101.6 | 15.6 |
| 70 | 121.4 | 21.1 |
| 80 | 143.6 | 26.7 |
| 90 | 168.4 | 32.2 |
| 100 | 195.9 | 37.8 |
| 110 | 226.4 | 43.3 |
| 120 | 260 | 48.9 |
| Temp (F) | R-11 | R-12 | R-22 | R-123 | R-134A | R-500 | R-502 |
|---|---|---|---|---|---|---|---|
| -100 | 29.8 | 27 | 25 | 29.9 | 27.8 | 26.4 | 25.3 |
| -90 | 29.7 | 25.7 | 23 | 29.8 | 26.9 | 24.9 | 20.6 |
| -80 | 29.6 | 24.1 | 20.2 | 29.7 | 25.6 | 22.9 | 17.2 |
| -70 | 29.4 | 21.8 | 16.6 | 29.6 | 23.8 | 20.3 | 12.8 |
| -60 | 29.2 | 19.0 | 12.0 | 29.5 | 21.5 | 17.0 | 7.2 |
| -50 | 28.9 | 15.4 | 6.2 | 29.2 | 18.5 | 12.8 | 0.2 |
| -40 | 28.4 | 11.0 | 0.5 | 28.9 | 14.7 | 7.6 | 4.1 |
| -30 | 27.8 | 5.4 | 4.9 | 28.5 | 9.8 | 1.2 | 9.2 |
| -20 | 27.0 | 0.6 | 10.2 | 27.8 | 3.8 | 3.2 | 15.3 |
| -10 | 26.0 | 4.4 | 16.4 | 27.0 | 1.8 | 7.8 | 22.6 |
| 0 | 24.7 | 9.2 | 24.0 | 26.0 | 6.3 | 13.3 | 31.1 |
| 10 | 23.1 | 14.6 | 32.8 | 24.7 | 11.6 | 19.7 | 41.0 |
| 20 | 21.1 | 21.0 | 43 | 23.0 | 18.0 | 27.2 | 52.4 |
| 30 | 18.6 | 28.4 | 54.9 | 20.8 | 25.6 | 36.0 | 65.6 |
| 40 | 15.6 | 37.0 | 68.5 | 18.2 | 34.5 | 46.0 | 80.5 |
| 50 | 12.0 | 46.7 | 84.0 | 15.0 | 44.9 | 57.5 | 97.4 |
| 60 | 7.8 | 57.7 | 101.3 | 11.2 | 56.9 | 70.6 | 116.4 |
| 70 | 2.8 | 70.2 | 121.4 | 6.6 | 70.7 | 85.3 | 137.6 |
| 80 | 1.5 | 84.2 | 143.6 | 1.1 | 86.4 | 101.9 | 161.2 |
| 90 | 4.9 | 99.8 | 168.4 | 2.6 | 104.2 | 120.4 | 187.4 |
| 100 | 8.8 | 117.2 | 195.9 | 6.3 | 124.3 | 141.1 | 216.2 |
| 110 | 13.1 | 136.4 | 226.4 | 10.5 | 146.3 | 164.0 | 247.9 |
| 120 | 18.3 | 157.7 | 259.9 | 15.4 | 171.9 | 189.2 | 282.7 |
| 130 | 24.0 | 181.0 | 296.8 | 21.0 | 199.4 | 317.0 | 320.8 |
| 140 | 30.4 | 206.6 | 337.2 | 27.3 | 230.5 | 247.4 | 362.6 |
| 150 | 37.7 | 234.4 | 381.5 | 34.5 | 264.4 | 280.7 | 408.4 |
What is an HVAC Pressure Temperature Chart?
An HVAC pressure temperature chart is used to check if a unit is operating at the correct pressure when matched to the outside temperature.
They can also be used when the refrigerant in a system is unknown since the pressure and temperature will point to the type of refrigerant in the system.
Likewise, when the refrigerant type is known and the outside temperature is known, the correct pressure can also be found.
HVAC refrigerants have different boiling temperatures called the saturation point.
The saturation point is the temperature a refrigerant changes states from liquid to gas or from gas to liquid.
When using refrigerants, the saturation point can change depending on the pressure.
Also, depending on the refrigerant, the boiling point or saturation point will change.
To get the correct saturation temperatures, an HVAC tech will read the pressure and temperature then use a temp pressure chart to see if a unit is operating correctly.
The pressure-temperature relationship in a PT card is simply a chart listing the boiling temperatures of the refrigerant.
A PT card has pressures listed on the left side of the chart and the corresponding boiling temperatures for each of the listed refrigerants on the right.
The refrigerant at these conditions is referred to as saturated refrigerant can be 100 percent vapor, a mixture of liquid and vapor, or 100 percent liquid.
At temperatures above saturation, the refrigerant becomes superheated vapor; at temperatures below saturation, the refrigerant becomes sub-cooled liquid.
Thanks